Creating Delightful Graphs using HTML 5 Canvas
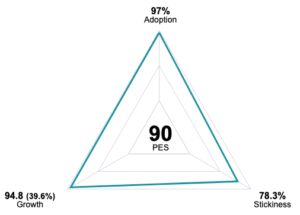
At Pendo, we collect tons of data, and we’re always finding new ways to showcase that data so our customers can see how their apps are being used and can make their software more lovable. One of the data visualizations we have been working on recently is Product Engagement Score. To calculate a Product Engagement Score, we combine Stickiness, Growth, and Adoption to show how invested users are in that product.
When working on Product Engagement Score, we had the opportunity to write a completely custom spiderweb chart. However, we used Highcharts for the first release. We had to do a lot of hacking to make it similar, rather than perfect, to the chart’s original design. The first issue was that Highcharts didn’t support the dead space in the center for the PES metric. To accommodate this we had each axis use the range 0 to 150, even though each metric is a value of 0 to 100. Then we added an extra series with values of 50 for each axis, and made it have a white background to form that center dead space. We also didn’t have the signature gradients present on the current Product Engagement Score chart, due to Highcharts not supporting the type of gradients we were looking for.
For our second iteration of the Product Engagement Score chart, we decided to go with something a bit more custom. We opted to use the HTML5 Canvas element, which allows you to draw 2D or 3D graphics on the fly. To draw you can choose from two APIs: Canvas Scripting, or WebGL. The Canvas Scripting API has easy-to-use functions for rendering 2D graphics such as drawing rectangles, arcs, text, and a ton more, which was perfect for our Product Engagement Score chart.
Now that we decided how we were going to render the chart, we needed to wrap it in something to make it reusable. For this we used a Vue component – however, we decided to use the new Composition API. This allowed us to leverage an amazing library called VueUse, which is an essential collection of Composables. A few of the Composables we ended up using for the chart are useRafFn for the main drawing loop, and useTransition for easing functions for our animations. Another benefit to using Vue is that we were able to separate the labels from the canvas and have them in the DOM, while still having it all in one reusable component. This allowed screen readers to be able to read the chart and for the labels to be accessible via keyboard.
We’ve talked about how we can use the canvas element to draw graphics on the fly, but how do we do animations and make sure the content on the chart stays up to date? We manage this through the main drawing loop, and inside of it a state machine to handle the chart’s multiple states, such as loading, animating, and static. To create this loop we used the useRafFn Composable from VueUse, which in turn uses the requestAnimationFrame function on the window object. This will call our callback function before the next repaint. This will usually be called 60 times per second or more (depending on the monitor’s refresh rate) which means our code needs to be optimized to not take too long. We made another optimization by stopping the main drawing loop when the chart is static. Whenever we need to do an animation or show the loading indicators we start it back up.
The result is a unique chart that users can specifically associate with Product Engagement Score. This also allows us to be more open to future design requests, as we aren’t pinned down by what a library supports. Additionally, we were able to architect the chart with accessibility in mind. Though canvas can be a great tool to create a unique chart, there are other ways to achieve the same result with less work depending on the chart. For example, in the Growth drill down on the Product Engagement Score page, the Active Visitors chart uses just HTML and CSS. A library may be a great idea for a quick win, but it’s always good to keep these alternatives in mind so that the data we provide to our customers can stand out.
Author: Nicole Mattera